The ichart editor
Queries are created using the iChart Editor which is a graphical based intuitive flowchart tool where the user adds nodes that each contains specific intelligence which performs a single task with the data.
There are many types of nodes that the user can connect together to create a flow in order to
- extract data from a data source
- select specific data (filter) using any criteria
- calculate new data fields from logic or formulae
- combine similar and / or different data from different sources
- group the data together to show relevant summaries or trends
- output the result into an iCube (result table)
- view and manipulate the final result in various selectable formats.
Each node has a description field where the user can include any description, explanation or note they want for each node. This appears under the node.
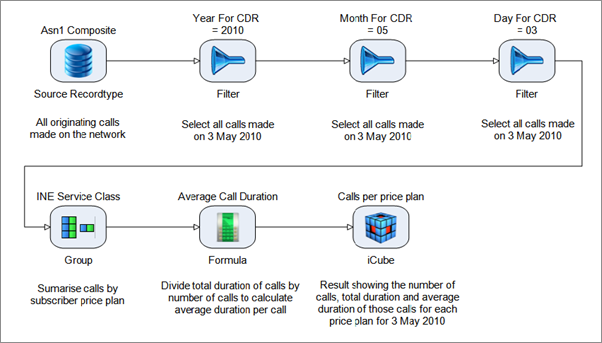
Below, is an example of a basic query which shows the number of telephone calls, cumulative duration and average duration of those calls per product price plan per day.
The query starts by selecting the data source, i.e. the call detail records from a mobile telephone network switch.
This raw data is then “filtered” on a specific date to select all the calls made (3 May 2010 in this example). This query could typically be run automatically every day so the daily trend could be monitored for any unexpected deviations and monthly cumulative figures (month to date) could be used for projecting the monthly total etc.
After the raw data is selected for the specific period the user is interested in by way of the “filter”, the data is then “grouped” to summarise it into useful information. The “group” is used because the user does not want to see each individual call made on the day but rather just wants to see the total number of calls and total duration of those calls for each price plan (called INE Service Class in the original data) per day.
Any number of formula nodes which perform calculations on the data can be added to the data after it has been extracted. In this example, the user may also be interested in calculating the average duration per call. This is done by the formula node which allows the user to create a new field called Average Call Duration (this is a user defined name) where the cumulative sum of the duration is divided by the number of calls for each price plan.
The iCube node executes the logic of all the preceding nodes and saves the result. The user can name the iCube and can also use any iCube for any new / further query or reconciliation. The original event data is not affected in any way by the iCube. The event data is maintained, in their original format in which they were first read into iServ, in the database. Therefore a user can simply define a new iCube if they wish to see additional details excluded from previously defined iCubes.
The nodes and resultant flowchart for the above described example would look as follows:
Queries can be executed manually or automatically in batch mode
Users chose whether they want to manually execute the iCube, or whether they want the iCube to be executed in batch mode.
An iCube would normally be executed manually when for example the user is performing an investigation or reconciliation or ad-hoc report and wants to receive an answer immediately.
The user would generally set the iCube to be executed in batch mode (e.g. daily or every half hour), when running a recurring report.
Viewing the results of a query or reconciliation
There are many different ways that the user can view the results of their query. The ways in which the results can be presented for view include:
- iGrid – a tabular format similar to Excel
- iGraph – a graphical display of the data in a chart (e.g. pie chart, bar chart etc)
- iReport – the results are presented in a professionally formatted report that can contain the actual results from the query in tabular and / or graphical format, additional free text, pictures, logos, etc.
- iMap – is a graphical representation of data where the values taken by a variable in a two-dimensional map are represented as colors
Users are not restricted to view the results in 1 format but can view the same results in multiple formats as well as automatically e-mailing these results to colleagues in the same or different formats.
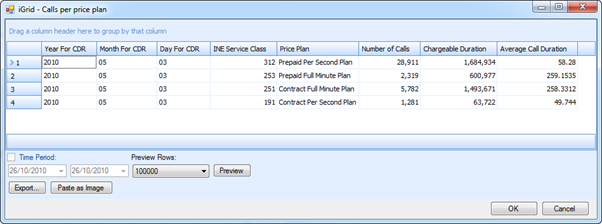
In the above example, the results from the query are viewed by the user in the iGrid which shows the results in a table format, as displayed below.
Analysis in iGrid
The iGrid includes functionality to sort the data on any field (column) or group the data on any field or combinations of fields. It is also possible to add filters (very similarly to Excel filters) to multiple fields or do calculations such as Sum, Average, Minimum, Maximum, Count. Users can also hide selected fields or highlight a cell, column or row.
Output results to tools users most comfortable working in
Often self-service BI proves overwhelming for all but the most sophisticated power users. Many users find the concept of BI query, reporting and analysis tools intimidating and therefore are reluctant to make full use of them no matter how user friendly or easy to use. These users will typically merely review standard reports but not reformat or manipulate them into different views to better suit their analysis or onward reporting requirements.
For the majority of these users, Excel is the query, reporting, analysis and planning tool of choice.
Therefore, in addition to being able to be viewed in the above ways, the results can also be output directly into most business user friendly formats such as, but not limited to, Excel, PDF, rich text format (Word), html, bitmap, jpeg, etc. Thus users can analyse, manipulate and report on the data in a tool they are most comfortable with.
Easy distribution of results
Distribution of information and reports is made easy by the inclusion of automatic e-mail functionality. In this way, any of the multiple views used for viewing the results of queries as described above, can be automatically e-mailed to specified recipients every time the query is run. These recipients need not be users of or even have access to iServ.
Enriching data on the fly
In order to increase the ease of use of the data or enhance the understanding for presentation purposes, business users are able to enrich the data themselves at any time.
These enrichments can be done by including new data fields by merging original fields with additional sources of data (e.g. customer data), performing calculations on certain fields or combinations of fields (e.g. dividing the duration of calls by the number of calls to get the average duration per call), combining original fields with reference data (e.g. referencing the value in an original field to the reference data that translate it to a usable value such as a reference number to a product name) etc.
These data enrichments can apply retrospectively to the data without any intervention or assistance from IT technical personnel. The enriched data can then be used by the business user in their queries and reports. I.e. if the user designs a new report at the end of the month, the user can apply the enrichment to the data right from the beginning of the month (or prior months) and run their report accordingly.
These enrichments are derived from the event data original fields or are created in conjunction with some other information, e.g. customer information from a separate data source or reference document. The event data fields originating from the original event data are called “Original” parameters. The enriched fields that are generated after the event data analyses are called “Generated” parameters.
Modify existing queries with ease
The intuitive nature of the flowchart makes it very easy to update an existing iChart that needs to be altered because of changes to the surrounding data or to enable other users to understand and interpret the data better.
To follow on from the example described in “creating a query” above, the field entitled “INE Service Class” may not be understood by most persons reading the report. And even those users who understand what “INE Service Class” means may not know what the actual values 191, 251, 253, and 312 therein may represent exactly.
The field INE Service Class reflects the price plan (price package) the mobile telephone subscriber is on and the values 312 (Prepaid per second), 253 (Prepaid full minute), 191 (Contract per second), and 251 (Contract full minute) represent the specific price plan the subscriber is subscribed to.
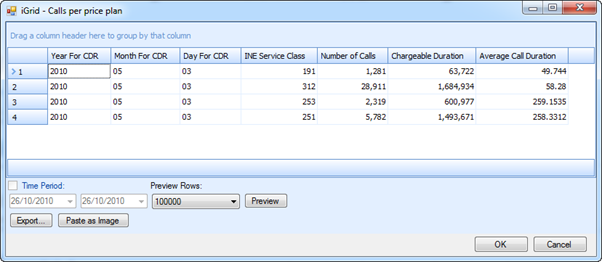
Therefore the original iChart constructed to perform the original query, as described in “creating a query” above, can simply be updated by inserting an enrichment in the form of a new “field enrich” node in the flow (inserted between the formula node calculating Average Duration and the iCube). This enrichment translates the “INE Service Class” into the “price plan” which makes the report understandable to all users.

The output from this modified query will look as follows in the iGrid.